To save colors and take care of the planet, print this text in shades of gray
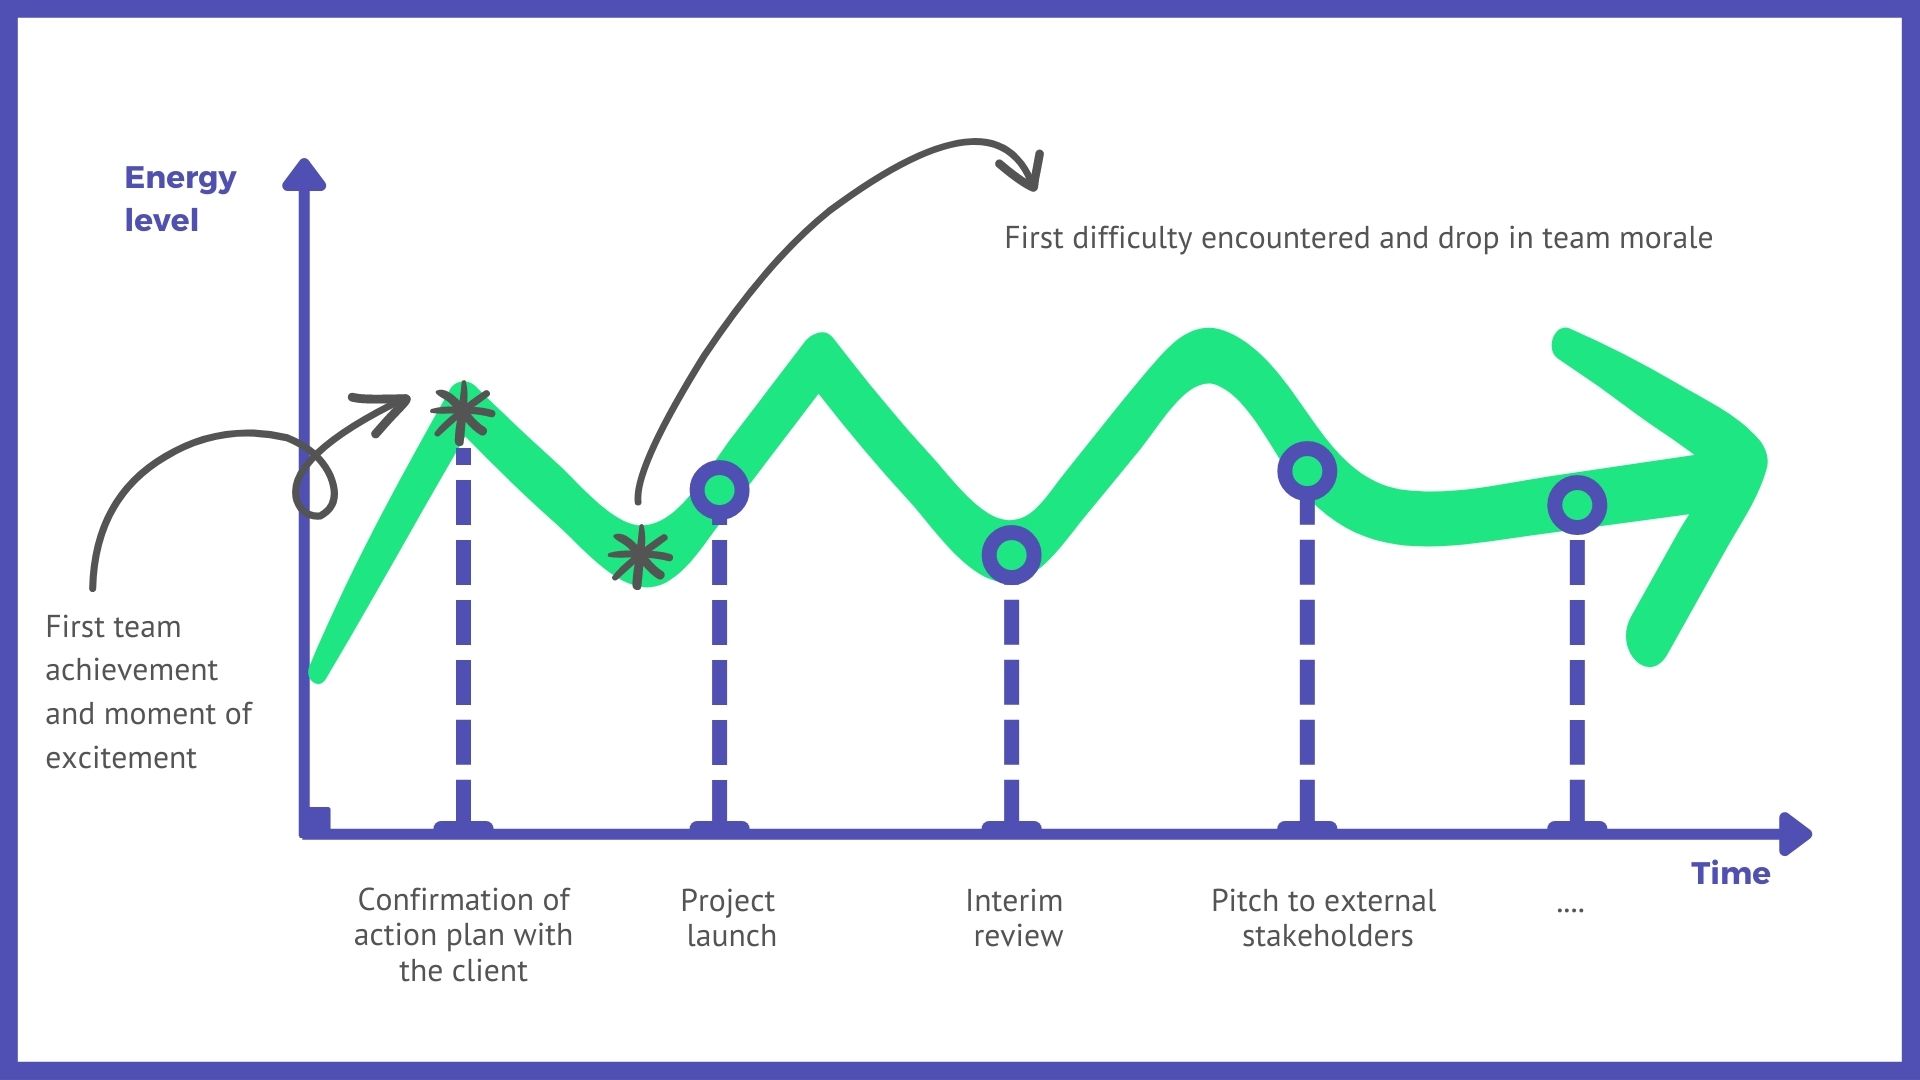
The energy graph
Reflect on a situation by combining facts with emotions
Pratique
Aim
The energy curve can be a useful way of taking stock of a project or period of activity. The advantage of this tool is that it combines identifying facts with analysing the impact of these key events on the team’s energy levels and motivation.
Instructions
Time needed: 20 to 45 minutes
Materials:
- Paper
- Something to write with
Key steps
- Once you’ve decided on the focus of your review, invite each participant to reflect individually for a maximum of 10 minutes and draw a graph with:
- a time scale on the x-axis, corresponding to the duration of the given project or period of activity,
- energy level on the y-axis (individual and/or group).
The peaks and troughs indicate rising and declining energy levels, correlating with the key events or facts indicated by the participants on the graph.
- Share with the group
The participants take it in turns to explain their graph and their experience in terms of energy levels throughout the given period and key events. - Debrief
Finally, set some discussion time aside to identify the recurring themes and key differences, so that the participants can learn from the task for future projects.
Tips and advice
- If some participants have joined the team or project more recently than others, ask them to produce a graph that focuses purely on the time during which they’ve been involved, and to take on more of an observer/interrogator role during the debriefing.
- You can also suggest the group uses the KISS tool following this exercise to help them identify what they have learned and plan for the future.